

Acrylic pie graph, pie graph on plexiglass, plexi pie graph
FILTER RESULTS
Image orientation: all
horizontal
vertical
square
Filetype: all
photo
illustration
vector
Apply
#422121958
 Circle pie chart. 2,3,4,5,6,7,8,9,10,11,12 sections or steps. Flat process cycle. Progress sectors.
#237816143
 Set of circle percentage diagrams (meters) from 0 to 100 ready-to-use for web design, user interface...
#387998135
 Colored pie chart set. Circle percentage diagram for application infographic, UI, web design,...
#354810160
 Blue gradient infographic with element icons. Flat design pie charts, graph bars for ads app logo...
#190406891
 Business infographics. Pie charts with 3, 4, 5, 6, 7, 8 sections. Vector templates.
#255954008
 Business colorful pie chart template with circle in the center. Background for your documents, web...
#297712620
 Pie chart full set, ring percentage diagram collection, loading circle icon, black isolated on white...
#288536763
 Pie chart set. Colorful diagram collection with 2,3,4,5,6 sections or steps. Circle icons for...
#492558487
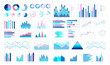
 Modern infographic data graphs template vector set. Editable website dashboard interface, pie chart,...
#105771084
 Vector circle arrows infographic. 3, 4, 5, 6, 7, 8 options, parts, steps. Template for cycle...
#603222927
 set of colorful dark cool pie chart, visual chart
#180534198
 Infographic Elements
#417750576
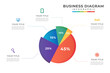
 Infographic template for business. 5 steps Modern 3D pie chart diagram, presentation vector...
#109466081
 Statistical pie chart / piechart flat icon for apps and websites
#644447703
 Pie Chart diagram element, presentation vector infographic template for business
#443250592
 A set of charts and graphs related vector icons for your design. Graphics and statistics icons set....
#335323954
 Collection of pie charts divided into parts or sectors
#252375678
 Set of business cycle flow diagrams, pie chart for documents,reports,presentations,infographic,0 5...
#513143430
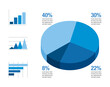
 Business infographic elements set. Financial presentation visualization collection for analytics and...
#437767608
 infographics collection
#421215162
 Pie charts diagrams. Set of different color circles isolated. Infographic element round shape....
#533365070
 Pie chart, diagram. Black outlined circle divided in three parts, in thirds.. Isolated png...
#559082250
 Statistics icon set. Containing data, web statistics, survey, prediction, presentation, cloud...
#354808974
 Minimalistic colorful infographic with element icons. Flat design pie charts, graph bars for ads app...
#442508794
 Set of icons for creating business infographics. Flat style illustration.
#255945551
 Business colorful pie chart template with big circle in the center. Background for your documents,...
#308425022
 Pie circle chart. 12 section. Vector circle graph for infographic. Twelve flat cyrcle diagram. 1, 2,...
#567746109
 Circle pie chart icons. Pie charts diagram. Colorful diagram. Set of different color circles...
#223184944
 Vector infographic circle. Cycle diagram with 6 options. Can be used for chart, graph, report,...
#556370979
 Growing bar graph icon set. Business graphs and charts icons. Statistics and analytics vector icon....
#596730155
 Colorful dark cool pie chart, visual chart
#219634167
 Set of circle percentage diagrams from 0 to 100 ready-to-use for web design, user interface (UI) or...
add to favorites